Skip to content
GrowthTag Solutions logoGrowthTag

Analytics & Tracking case study

GA4 Ecommerce Tracking & Reports

Every product view, add to cart, checkout and purchase tracked in GA4 with revenue, then turned into reports that show which channels make money and where shoppers drop off.

Industry
E-commerce
Location
USA & Saudi Arabia
Category
Analytics & Tracking
Client accounts
2
935
Purchases tracked
Itsmine · in 4 weeks
SAR 315K
Revenue tracked
Itsmine · by channel
4.9M
Items viewed
product-level tracking
$12.4K
Revenue tracked
TractorReliefTool · 1 month
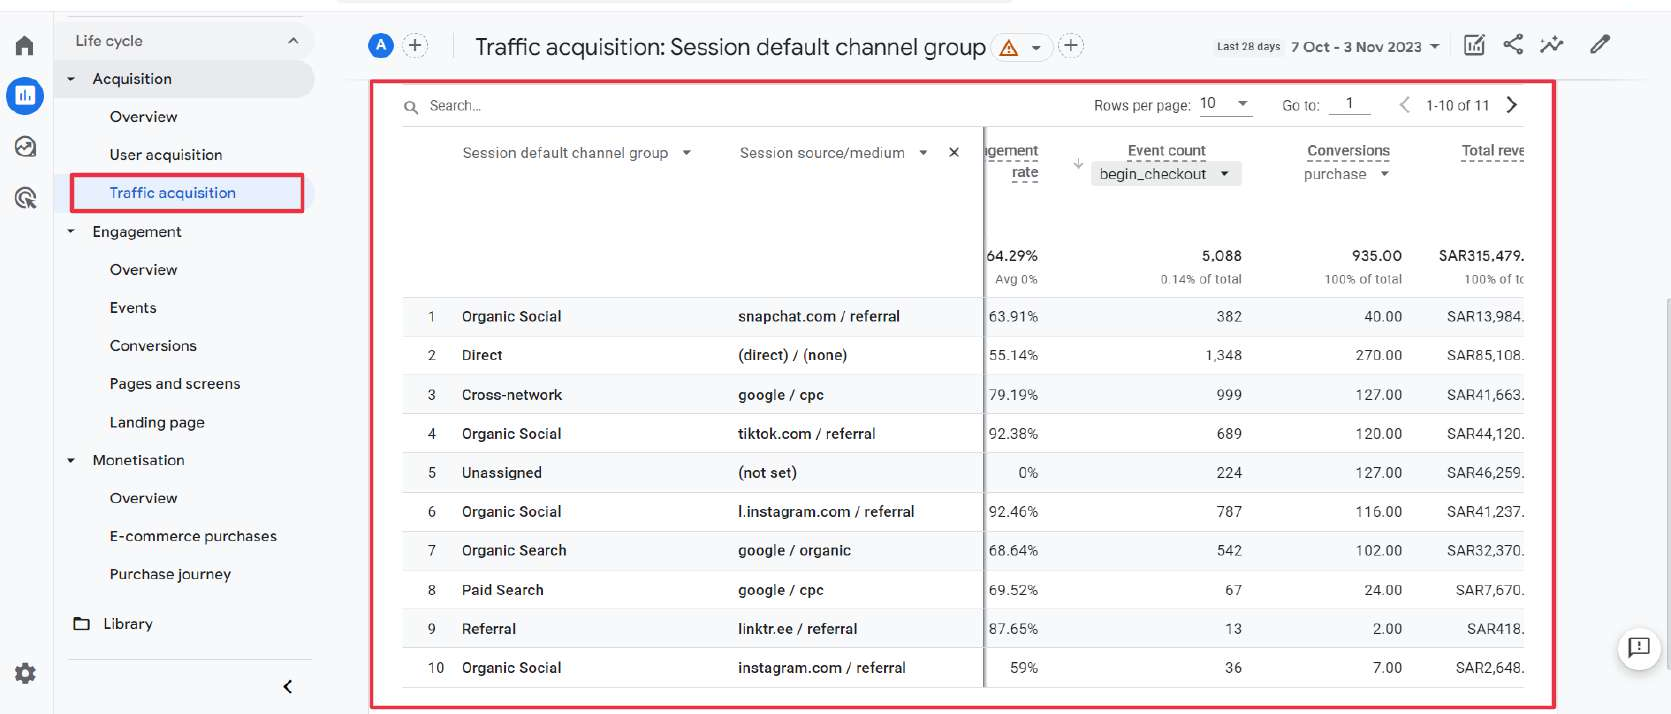
GA4 Traffic acquisition, Itsmine, Oct 7 – Nov 3, 2023: purchases and revenue credited to each channel

Results at a glance

Straight from the ad accounts

Every number below comes from the client's own dashboard, for the period shown on each case study.

01TractorReliefToolUSA · GA4 e-commerce, server-side GTM$12,425 revenue from 39 buyers$4,236 from Google Ads
02ItsmineSaudi Arabia · GA4 e-commerce, server-side GTM935 purchases trackedSAR 315K revenue

Taken from each client's GA4 property. Periods are shown on each case study.

Context

If GA4 can't see your sales, you can't see your business

Out of the box, GA4 records page views, not money. Without e-commerce tracking you can't tell which products sell, which channels bring buyers, or where shoppers give up. I set up the full purchase funnel so every report answers those questions with real revenue.

  • The e-commerce events I track

    view_item_list, view_item, view_search_results, add_to_wishlist, add_to_cart, remove_from_cart, begin_checkout, add_shipping_info, add_payment_info and purchase. Each event carries product name, ID, category, price, quantity and order value, so GA4 can report revenue by product, channel, campaign, device and country.

  • Server-side tracking

    Events go through a server container before reaching GA4, which holds up better against ad blockers and browser limits. The same purchase also feeds every ad platform, so all reports work from one clean data source.

  • Reporting the client can use

    Standard GA4 reports show totals; explorations answer the questions behind them. Every exploration is saved in the client's own GA4 property, so the team can open it any time with a new date range, without waiting for a report from me.

Method

How I work

  1. 1

    Audit

    Check what GA4 records today and compare it with your store's orders.

  2. 2

    Build

    Set up every e-commerce event in GTM, web and server side.

  3. 3

    Verify

    Test each event in Preview and DebugView, then match totals to real orders.

  4. 4

    Report

    Hand over reports, explorations and a dashboard your team can use.

Proof

How I build it, and the explorations I hand over

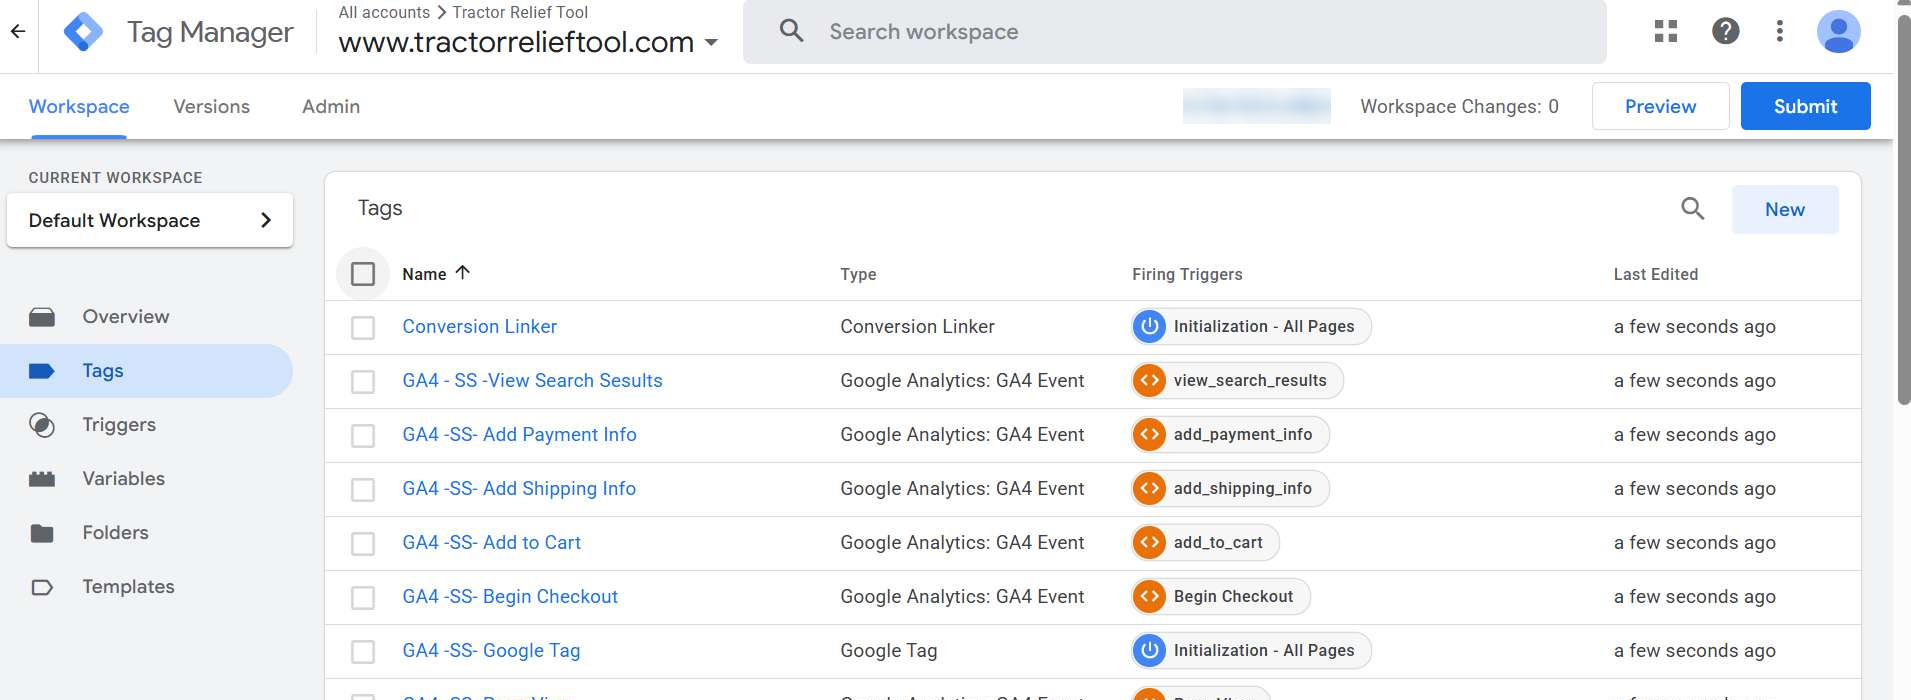
Web GTM, TractorReliefTool: a GA4 tag for every e-commerce step, sent to the server container
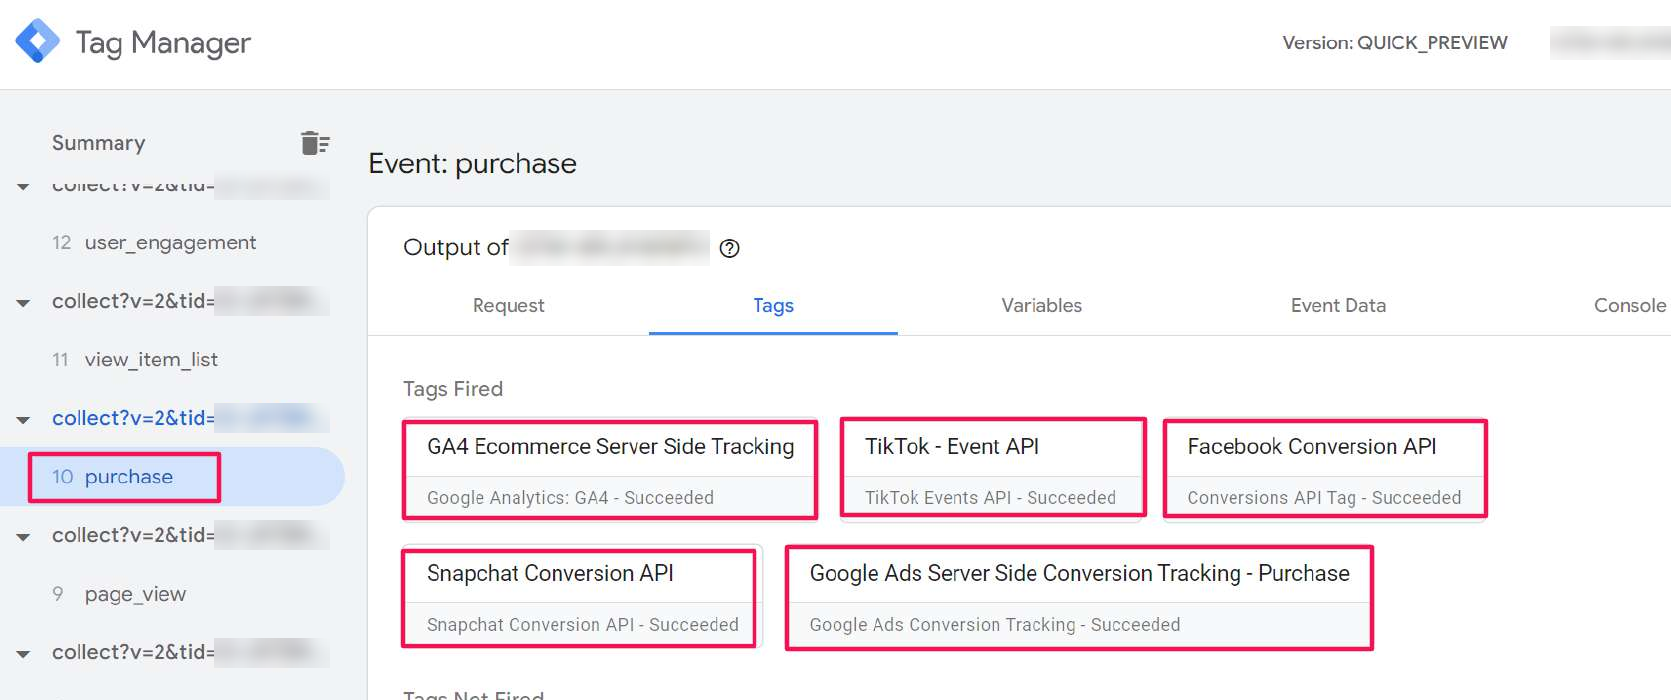
Server-side GTM preview, Itsmine: one purchase sent to GA4, TikTok, Meta, Snapchat and Google Ads
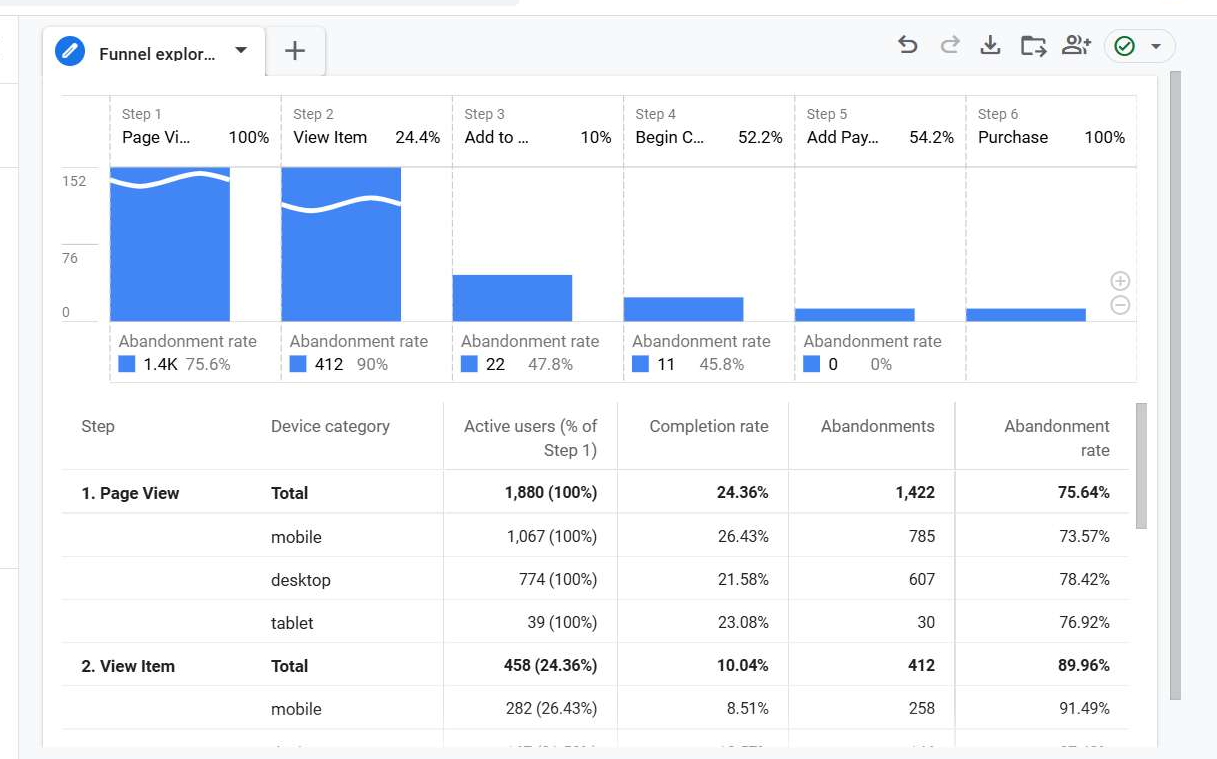
Funnel exploration · TractorReliefTool: 1,880 visitors through six steps to 13 purchasers, split by device, showing exactly where shoppers drop out.
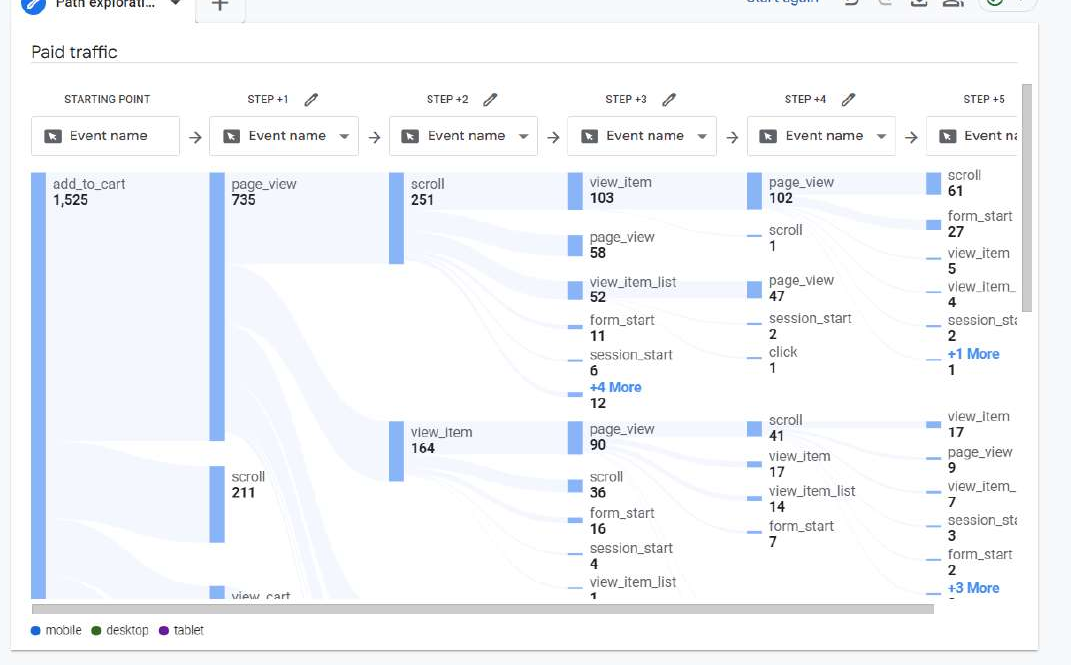
Path exploration · Itsmine paid traffic: the real routes shoppers take after adding to cart, including detours before they check out.
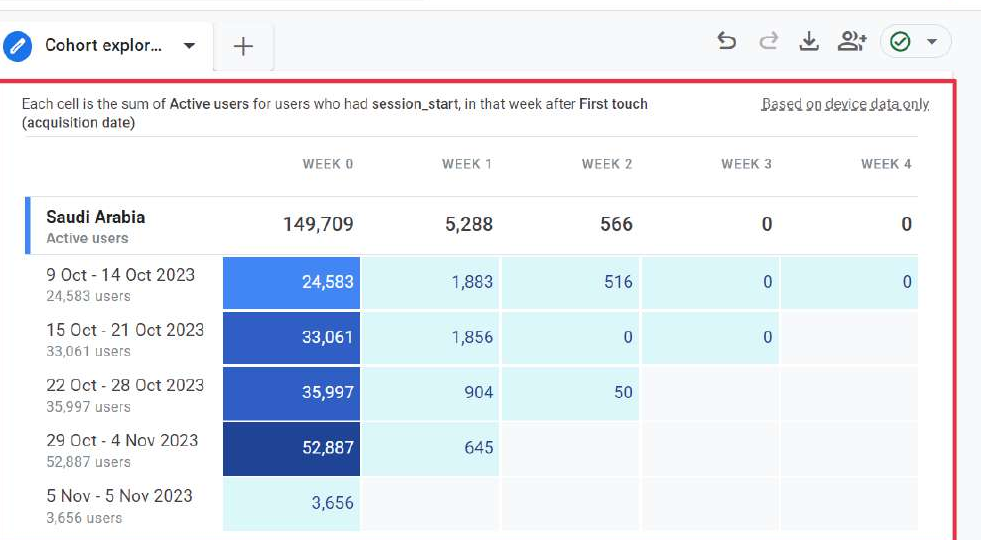
Cohort exploration · Itsmine, Saudi Arabia: weekly cohorts of new users and how many came back in the following weeks.

Case study 01 · TractorReliefTool

TractorReliefTool: $12,425 in Revenue Tracked by Source

Location
USA
Campaign / setup
GA4 e-commerce, server-side GTM
Period shown
Sep 1 – 30, 2025
Purchase revenue
$12,425
in one month
Buyers
39
~$319 per buyer
From Google Ads
$4,236
34% of revenue
Funnel tracked
6 steps
page view to purchase
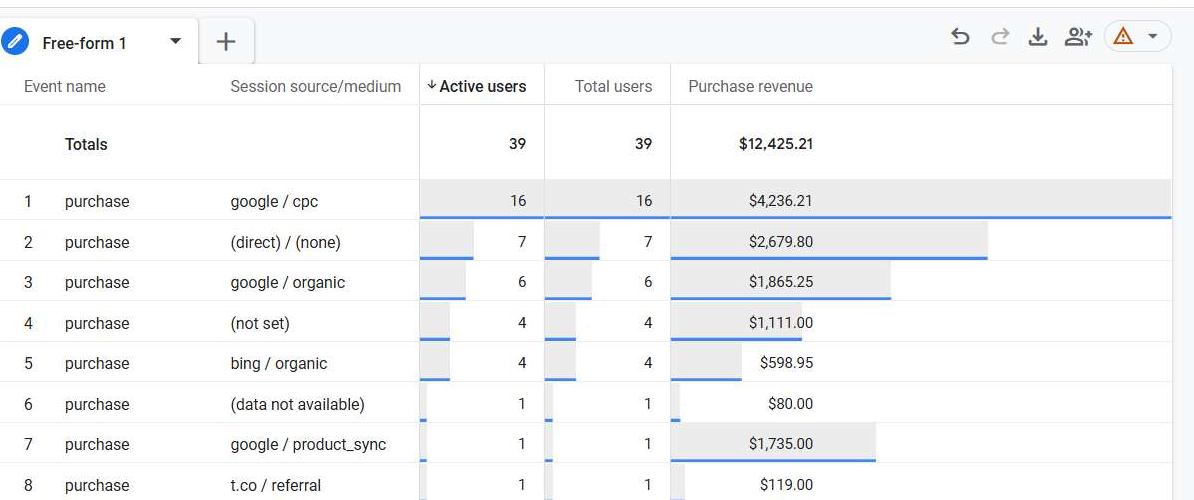
GA4 exploration, TractorReliefTool: purchase revenue by session source / medium, Sep 2025

The goal

A U.S. Shopify store selling hydraulic tools for tractors needed to know which marketing actually produced sales. Without e-commerce data in GA4, Google Ads, organic search and direct traffic all looked the same.

What I did

  • Set up GA4 e-commerce events in Google Tag Manager, from product view to purchase, with item and order values.
  • Sent events through a server-side GTM container alongside Google Ads conversion tracking.
  • Connected Search Console to see which organic queries bring visitors.
  • Built a revenue-by-source report and a six-step purchase funnel exploration.

Result

Google Ads is the top revenue source: $4,236 from 16 buyers, ahead of direct ($2,680) and Google organic ($1,865). The biggest leak is the product page: 90% of shoppers who viewed a product left without adding it to cart, the clearest place to improve conversion. 79% of visitors are in the United States, and the top organic search is the brand name itself.

Scope of work

  • GA4 property and data stream setup
  • Google Tag Manager web container
  • Full e-commerce events with item and order data
  • Server-side GTM
  • Google Ads and Search Console linking
  • Revenue-by-source report
  • Funnel exploration
  • Testing in GTM Preview and GA4 DebugView
Case study 02 · Itsmine

Itsmine: 935 Purchases and SAR 315K Revenue Tracked by Channel

Location
Saudi Arabia
Campaign / setup
GA4 e-commerce, server-side GTM
Period shown
Oct 7 – Nov 3, 2023
Purchases
935
in 4 weeks
Revenue
SAR 315K
credited by channel
Items viewed
4.9M
219K added to cart
Top browser
Safari
mobile · 55% of revenue
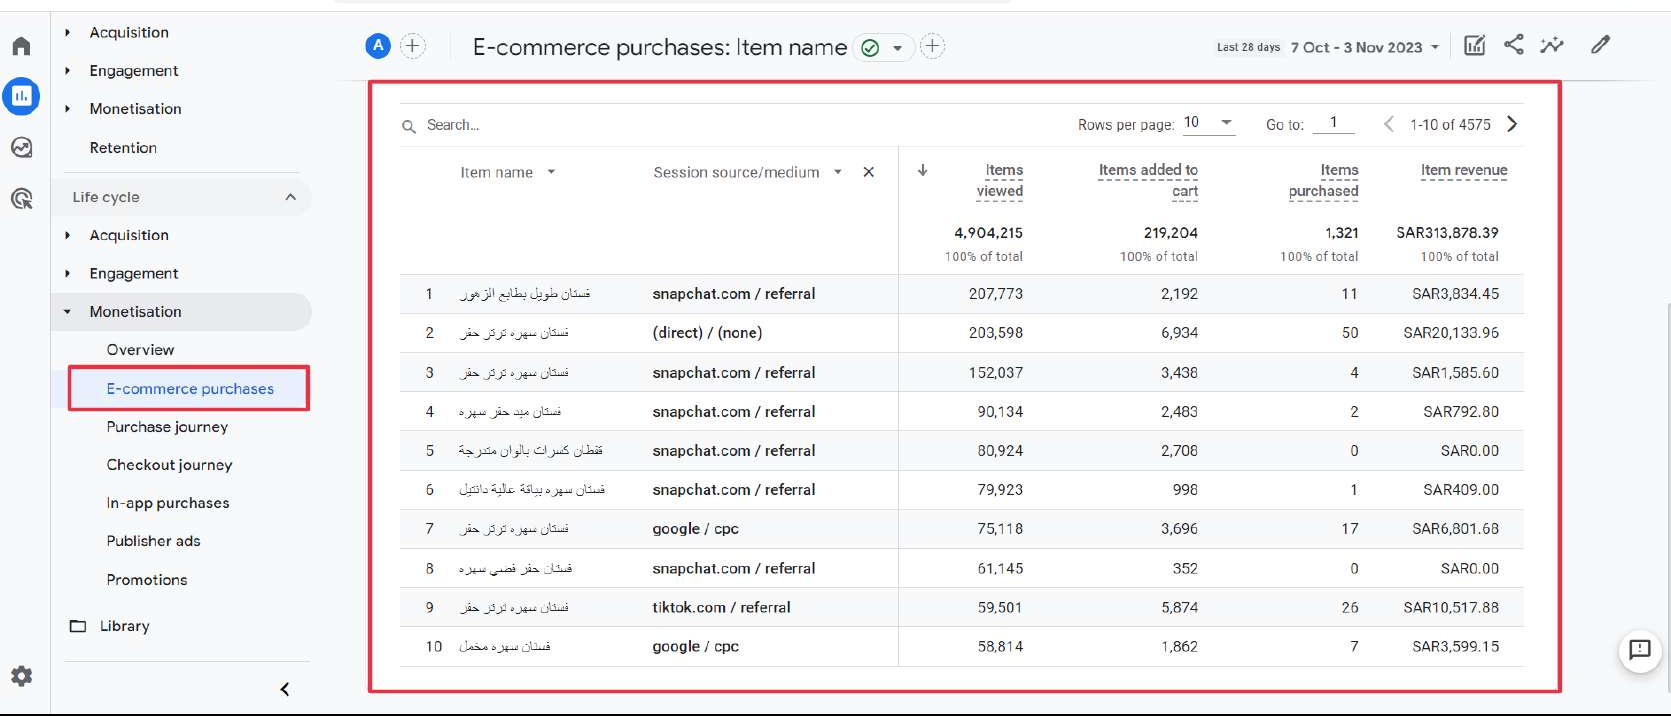
GA4 E-commerce purchases, Itsmine: item views, add to carts, purchases and revenue by product and source

The goal

A Saudi fashion brand selling across Snapchat, TikTok, Instagram and Google needed to see which channel really drove sales. With heavy social traffic and in-app browsers, most of that was invisible in standard reports.

What I did

  • Built full GA4 e-commerce tracking in GTM: item lists, product views, wishlist, cart, checkout, shipping, payment and purchase.
  • Routed GA4 through a server-side container that also feeds TikTok, Meta, Snapchat and Google Ads.
  • Set up channel, product, device and city reports, plus funnel, path and cohort explorations.

Result

Direct traffic drove 270 purchases and SAR 85K, while TikTok (120 purchases, SAR 44K) and Instagram (116, SAR 41K) were the strongest social channels. Safari on mobile produced 552 of 957 conversions and SAR 182K in revenue, so the mobile checkout is where improvements pay off most. In-app browsers matter: Safari in-app sessions, mostly from social apps, added SAR 111K in revenue.

Scope of work

  • GA4 property and data stream setup
  • Google Tag Manager web container
  • Full e-commerce events with item and order data
  • Server-side GTM feeding GA4, TikTok, Meta, Snapchat and Google Ads
  • Channel, product, device and city reports
  • Funnel, path and cohort explorations
  • Testing in GTM Preview and GA4 DebugView

Tools and platforms

  • Google Analytics 4
  • Google Tag Manager
  • Server-side GTM
  • Stape
  • Google Cloud
  • Search Console
  • Google Ads
  • Looker Studio
  • BigQuery
  • Shopify
  • WooCommerce
audit_requestedlead

Stop guessing. Start measuring what actually drives revenue.

Get a free audit of your tracking and ad accounts. You'll get a clear list of what's broken, what's missing and what to fix first — no obligation.